

Whether you want to use price action as your main strategy for your trading or not, learning about what price action is and how it works will help you tremendously. So yes, there is no reason not to learn it. In this article, we will tell you about price action, its setups and patterns. Ready? Let’s start.
What Is Price Action Trading?
Price action can be defined as the changes of price of a certain currency pair from time to time. In other words, the action or movement of the price. There is no trading strategy as simple as price action. It is true that price action is the simplest strategy but it is also true that it is the most powerful one.
There are no price action forex indicators but the current price and the past prices. Simply put, the focus is put on the movements or actions of the price (hence the name ‘price action) and nothing more. A trader could use other indicators if they wish to. Other indicators are helpful to an extent but they are not the focus.
Can you use a price action strategy intraday? Of course. The price action strategy can be used regardless of what kind of a trader you are. Yes, whether you are a scalp trader, an intraday trader, or a swing trader, the strategy will help you tremendously. Learning it will give you another arsenal for your trading. A simple and powerful one, nonetheless.
A Pure Technical Analysis
You can say that price action trading is technical analysis in its pure form. Why? Because, again, the focus is on the action of the price and the analysis doesn’t include any secondhand indicators derived from price. The focus is solely put on the firsthand data: the movement of the price over time, which the market creates about itself.
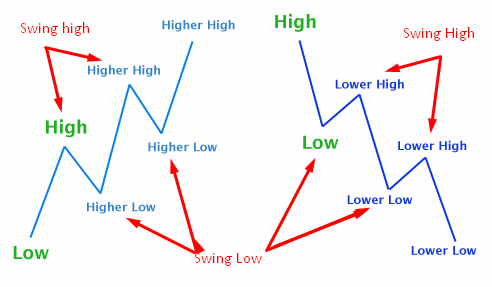
In a price action analysis, traders use the past history of a certain price movement in the market. Usually, traders are focused on the last 3 to 6-month time-frame. More distant history might also be included and given a lighter focus. The history of the price includes support and resistance levels, and swings, both highs, and lows.
You can make use of the action of the price to find out the thought process behind the movement of a market. Each participant in the market always leaves clues of the price action, which can be seen on the price chart as these participants trade their markets. These clues can be interpreted and used to predict the next movement in the market.
Keeping Things Simple
Earlier we said that price trading analysis is a pure form of analysis. That is true. It keeps things very, very simple. How could that be? Due to its simplicity, price action trading is also known as ‘natural trading’, ‘naked trading’, and ‘clean chart trading’ as it uses only price chart.
The stripped-down approach of this trading means that there are no indicators on the chart except the price as well as no economics news and events put into consideration when a trader makes a trading decision. While other traders assume variables to predict the price, price action traders assume that the price is the one reflecting those variables.
By assuming that the price reflects various variables, like economy reports, news events, etc. price action traders don’t need to sort, let alone decipher and interpret those variables to predict the price movement. That makes a lot of things simple, including the analysis. They do, however, put confirmation signals into consideration.
Confirmation Signals: Patterns
Just like many other trading strategies, there are confirmation signals that can help you to recognize the trend in the market. Below we give you three price action setups or patterns that could be confirmation signals. These patterns are inside bar pattern, pin bar pattern, breakout strategy and fakey bar pattern. We explain each one of these patterns below.
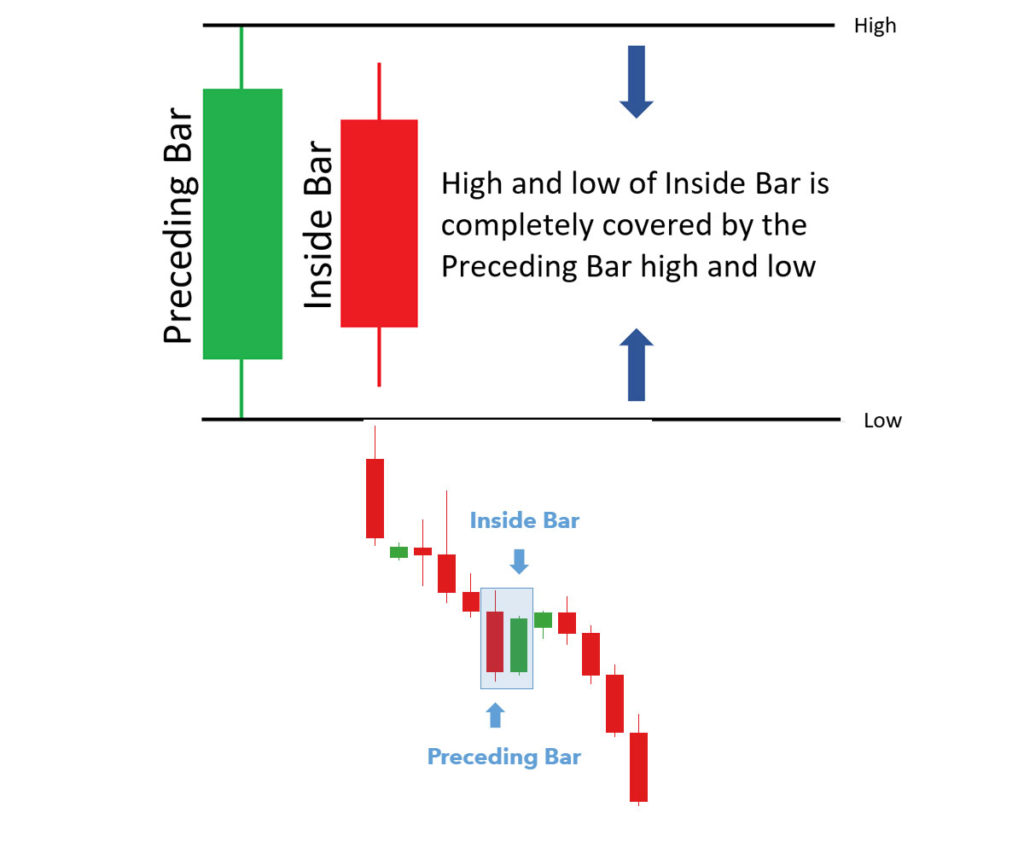
1. Inside bar pattern
The first example of price action patterns is the inside bar pattern. This pattern involves two bars, known as the mother bar and the inside bar. What makes a bar a mother bar or inside bar? A mother bar is the prior and longer bar, which completely contains the inside bar next to it.
The inside bar pattern can, not only an excellent trend continuation signal but also be a turning point confirmation signal as well. The pattern signifies a brief consolidation followed by a breakout in a certain direction. The direction of the breakout here depends on the dominant trend direction.
The inside bar pattern is among the best for traders who use daily and/or weekly charts. The pattern allows traders to engage in small risk yet high reward trades. As such, it would be very helpful to learn to use the inside bar pattern if you are a daily trader.
• How to use the pattern
The inside bar pattern can be traded following the trend direction in trending markets (known as breakout play) or counter to the trend (known as inside bar reversals). The classic signal for entry is to place either a sell or buy stop at the low or high of the mother bar. When price breakouts follow, the entry order is then filled.
What about stop loss placement? Where should be the stop loss placed? When it comes to the stop loss placement, traders usually place it either near the halfway point of the mother bar (at around 50% level) if the mother bar is bigger than average or at the mother bar’s opposite end.
2. Pin bar pattern
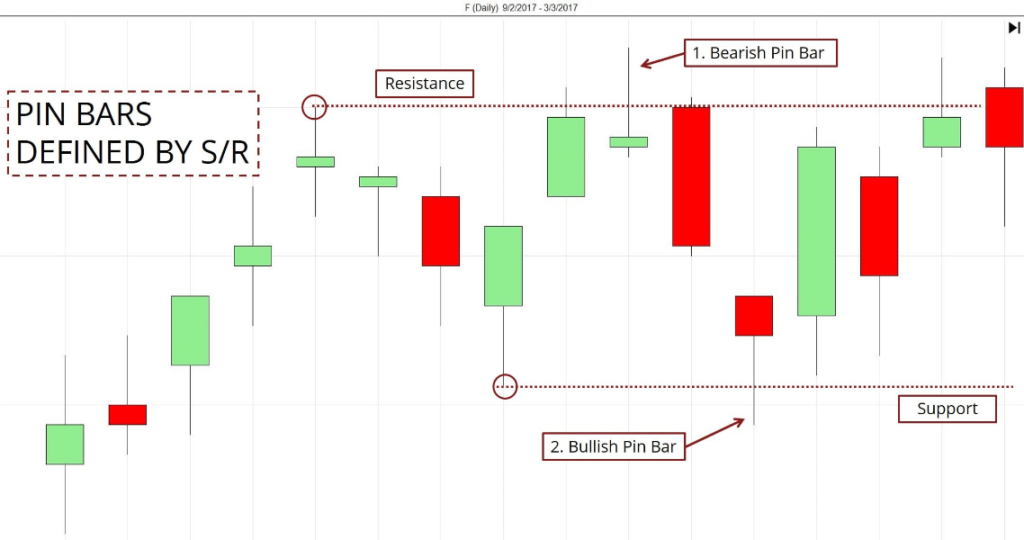
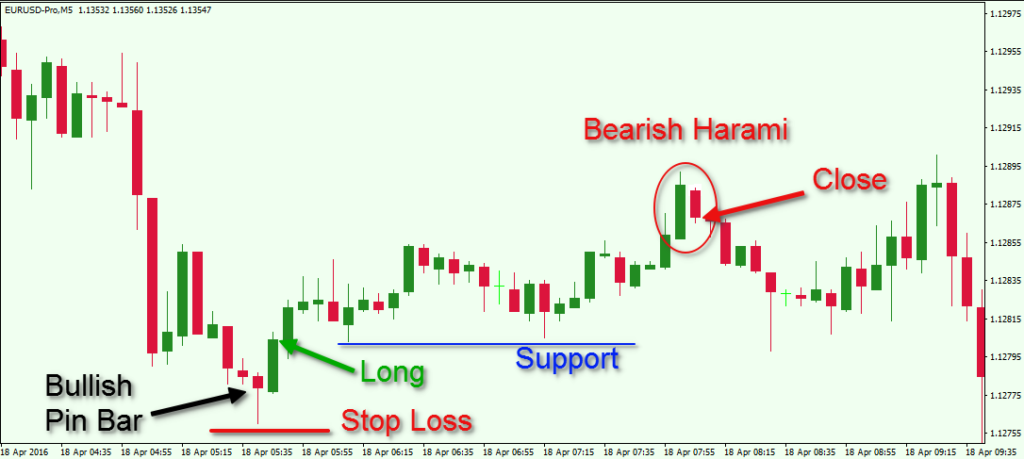
The next one is the pin bar pattern, which involves a single candlestick. There are two kinds of pin bar pattern: bearish and bullish. The bearish pin bar looks like a reversed pin with the head at the bottom while the bullish one looks like a normal pin with the head at the top.
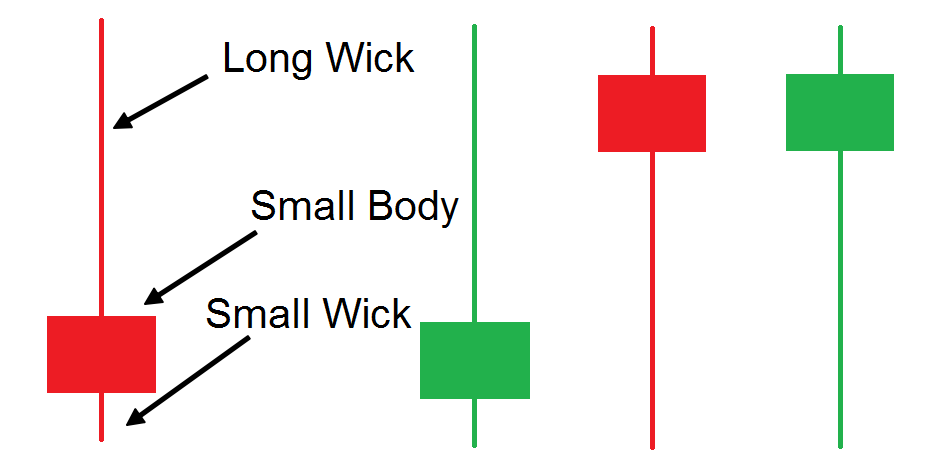
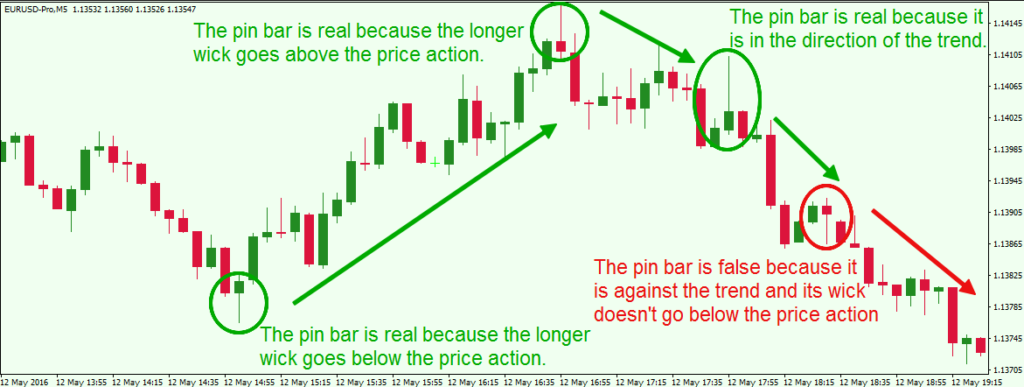
The pin bar pattern has a long tail and a short body. The long tail shows a certain area where the price was rejected. This implies that the price will continue the trend by moving to the opposite direction where the tail points. Thus, a bullish pin bar’s lower tail is longer while a bearish one’s upper tail is longer.
• How to use the pattern
Now, how does a trader use the pin bar pattern? There are three entry points that traders can use when using the pin bar pattern. The three entry points are ‘at market’, at 50% of the pin bar’s retrace, and ‘on-stop’ entry. Let’s get to know each one of the points briefly.
A. At market
This is the most popular entry points among price action traders. At market here means that a trader enters the market at its current price, hence the ‘at market’ name.
B. At 50% of the retrace
Unlike the ‘at market’ where a trader enters the market at its current price, a trader who enters at 50% of the pin bar’s retrace wait until the price is moving back to the halfway point or 50% level of the bar’s range.
C. On stop
Lastly, ‘on stop’ entry. A trader who uses this entry enters the market when the price is either above the bar’s high or below the bar’s low.
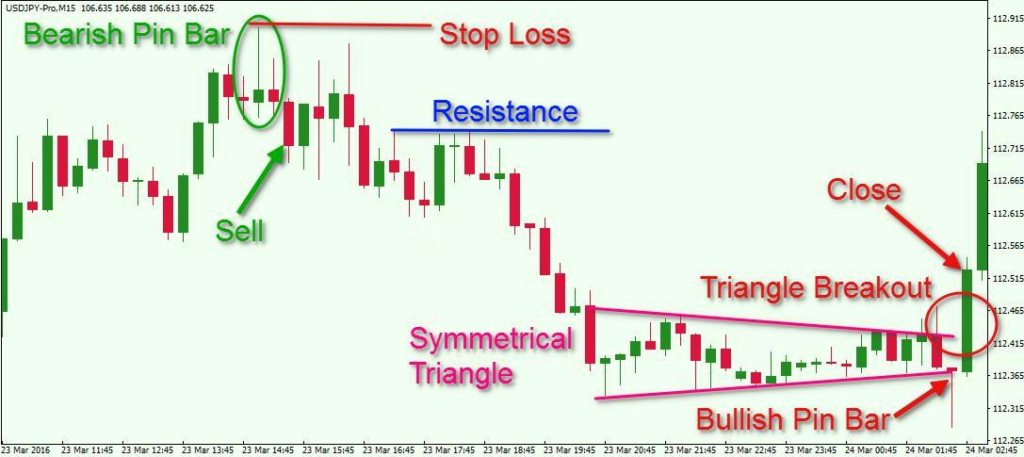
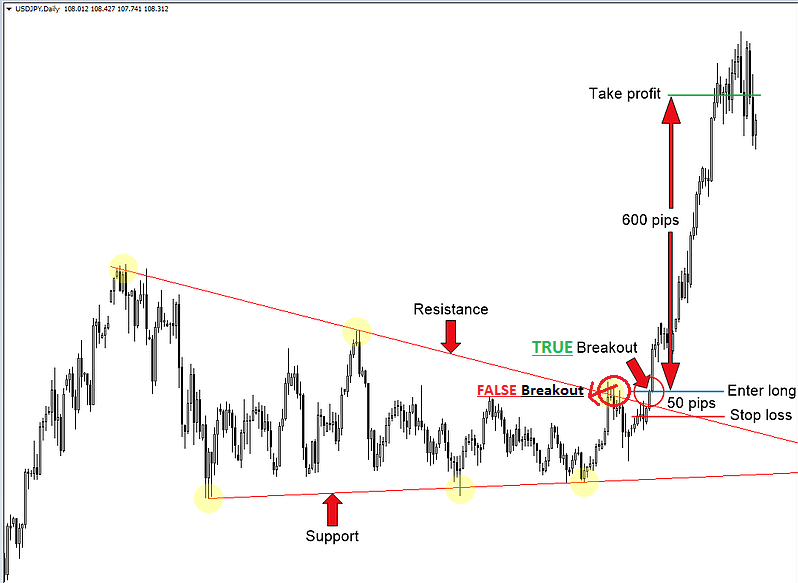
3. Breakout Forex Strategy
Use this breakout strategy for looking current trend and see this breakout at least in four hour time frame for swing or intraday and in one hour for scalping intra-day strategy.
Entry only in a base or ranging mode after breakout detected on one of those time time frame. Entry zone can be see on smaller time frame in one hour it self or 30 minutes and 15 minutes time frame.
So, first is looking for breakout then second looking for entry zone in small time frame and make sure using reversal candlesticks patterns as base entry then identify take profit using trend line.
4. Fakey pattern
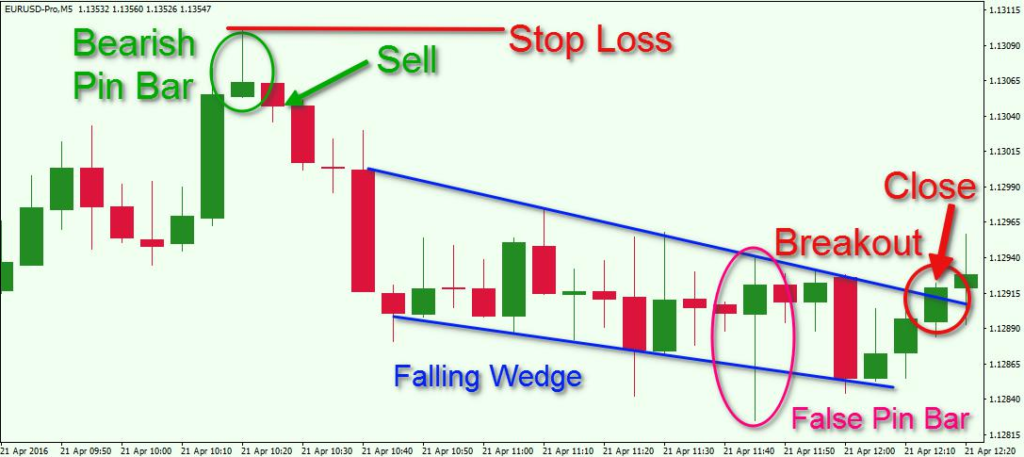
The fakey bar pattern involves a false breakout. It looks like a combination of the inside bar and pin bar patterns placed. Imagine an inside bar, then a pin bar next to it. A fakey pattern looks just like that. Why is it called fakey? Because it fakes traders out and gives a false signal.
This pattern is undoubtedly among the most important price action patterns that traders must learn. Why? Because it indicates either a trend might be continuing soon or the price might change direction. The pattern shows that there might be a breakout coming soon and yet, it is immediately followed by reverses.
• How to use the pattern
The thing is, false breaks happen in just about any market conditions. Doesn’t matter whether there is counter-trend, consolidation or trending, false breaks still happen. How do you trade it then? The best method to trade with fakey bar pattern is to trade it in-line with the current dominant daily chart trend.
Can you avoid getting caught in the false-breakout? Of course, you can. To avoid getting caught, just wait until the price is closed outside of the trading range for two or more days or if body candle [open-close] candle has closed outside of trading range, so not wicked. When this happens, there is a good chance the trading range is ended and the price will start a trend again.
To use make the most out of this pattern, you need to be able to recognize a false breakout when it happens. It could signify a new trend is starting or an end of the current trend. Either way, if you get the pattern right, the reward would be lucrative.