

Compared to other chart types, the candlestick charts are packed with so much information in so little space. Not surprisingly, by mastering the candlestick charts you will be able to analyze your trade easily and quickly. This is the reason why mastering them is important. And here we will help you do just that.
Origin Story
Let’s get to know about the candlesticks patterns first. Where did it come from? The candlesticks patterns chart originated from Japan, first used in the 18th century by a rice trader named Munehisa Homma. Although the candlesticks patterns chart is very common nowadays, it wasn’t until early 1990 that it has gained popularity thanks to Steve Nison.
Candlesticks Patterns Explained
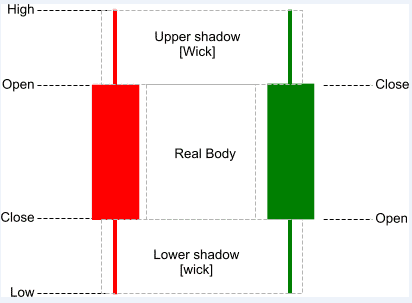
Moving on from the origin story, now let’s get to know the parts of the candlesticks patterns. The first time you see the candlesticks patterns you probably wonder why they are shaped so. They often look like a candlestick with a wick on its top and bottom. Hence, the candlesticks name.
There are four parts of the candlestick: open, close, high and low. Where these parts are identified depending on what kind of a candlestick it is.
• The bullish candlestick, which signals an uptrend, is usually colored white, with the open on the bottom, the close on the top, the high on the upper wick, and the low on the lower wick
• The bearish candlestick is the exact opposite of the bullish candlestick. It signals a downtrend, usually colored black and has the open, close, high and low order in reverse (the open on the top, the close on the bottom, and so on)
But what exactly open, close, high and low mean? These four parts represent four values on a chart.
• Open
Open means the opening price of a currency pair at the beginning of a given period
• Close
Close means the closing price of a currency pair at the end of a given period. The space in-between the open and the close is known as the body.
• High
The highest price that a currency pair reaches during a given period
• Low
The lowest price that a currency pair reaches during a given period. The high and the close are collectively known as the wick or the shadow.
In short, when you see a candlestick, you get four values of a currency pair in a single place. Due to this, understanding and analyzing a chart becomes a lot easier. Not to mention they look not just more appealing but also easy on the eyes compared to lines or bars charts too.
Reversal Candlesticks Patterns
Let’s talk about patterns now. There are two patterns: reversal bullish candlesticks patterns and reversal bearish candlesticks patterns. The former signifies that the buyers are currently in control, while the latter signifies that the sellers are currently in control. Do keep in mind that this control is temporary. Let’s start with the reversal bullish first.
Reversal Bullish Candlesticks Patterns
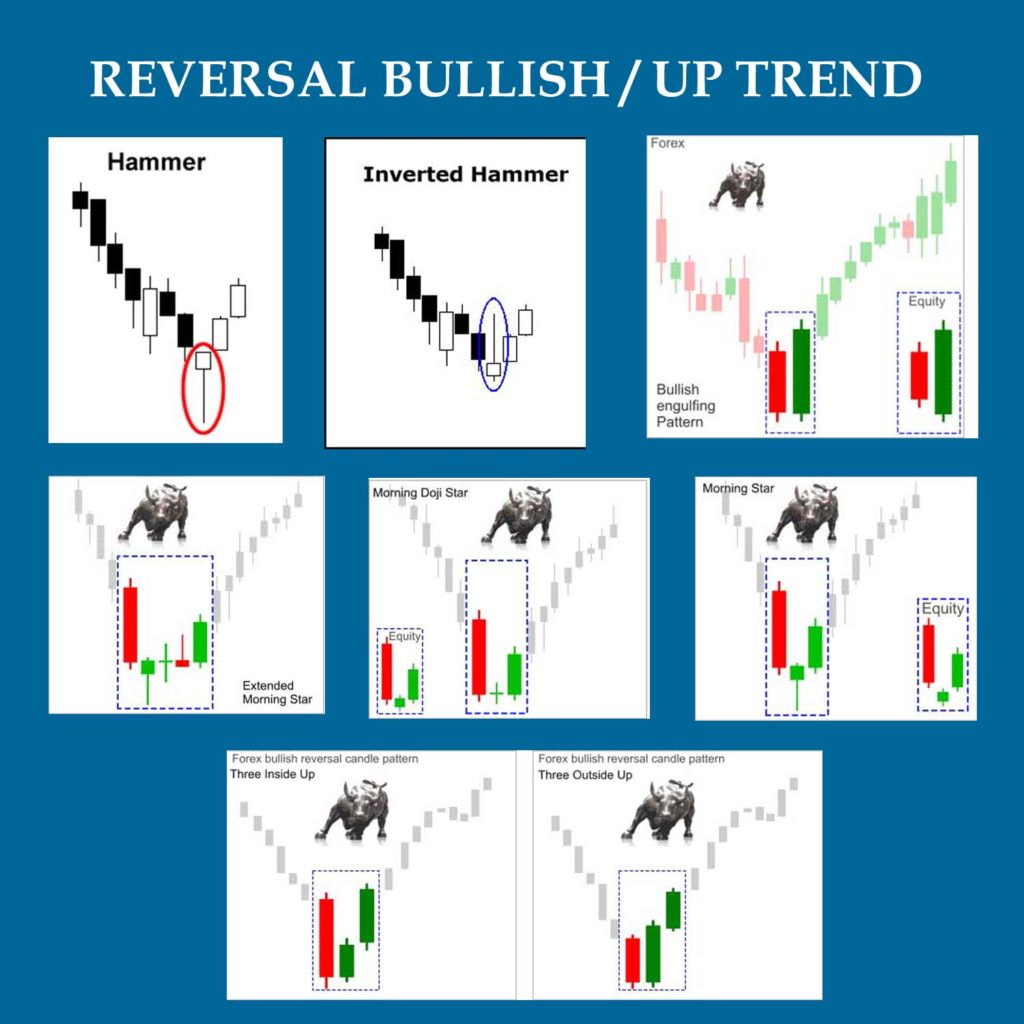
There are 5 trading confirmation for best entry signalsfor the reversal bullish candlesticks patterns:
1. Engulfing (two-candle)
The first candlestick has a bearish close followed by a candlestick that has a bullish close. The second candlestick is ‘engulfing’ or ‘covering’ the length of the first one (the wicks are not considered).
The pattern has two meanings:
• The sellers have a momentary control of the price, as shown in the first candlestick where it is closed bearish
• The buyers took over the control from the sellers, as shown in the second candlestick which shows huge buying pressure
2. Hammer (one-candle)
A hammer pattern has little to no upper wick but a long lower one (around twice or thrice of the body’s length), and the price is closed at the top quarter of the range.
The pattern signifies several things:
• After the market is opened, the sellers took control. They then pushed the price lower
• When the selling climax is reached, huge buying pressure came into play which pushed the price higher
• This buying pressure is so strong it closed above the open part of the candlestick
3. Piercing (two-candle)
A piercing has a bearish close on the first candlestick and a bullish close on the second one. It is similar to the engulfing pattern. The difference is that the second candlestick is smaller and covers slightly over half of the first candlestick.
The piercing pattern means two things:
• The sellers have a momentary control over the price as the first candlestick shows
• There is buying pressure moving the price higher
4.Morning star (three-candle)
The next reversal bullish candlesticks patterns are the morning star. It has three candlesticks. The first one closes bearish, followed by a small range on the second, and the third closes much higher than the first (over 50% of the first one).
A morning star signifies:
• On the first candlestick, the sellers have the control as the price is closed lower
• On the second, the market is in indecision as the buying and selling pressure cancel each other out
• On the third, the buyers took over the control as the price is closed higher
5. Tweezer bottom (two-candle)
This pattern shows that there is a rejection of lower prices which is shown on the first candlestick, followed by retesting of the first candlestick on the second candlestick, closing the price higher.
There are two meanings of the pattern:
• The sellers tried to push the price lower, which then faced some buying pressure. This is seen on the first candlestick
• The sellers tried to push the price lower again. This time, however, they failed and the price moves upward, which can be seen on the second candlestick
Reversal Bearish Candlesticks Patterns
Now let’s get to the reversal bearish candlestick patterns. Just like the bullish counterparts, these too have their own forex candlesticks confirmation. There are five patterns: engulfing, shooting star, evening star, dark cloud cover, and tweezer top.
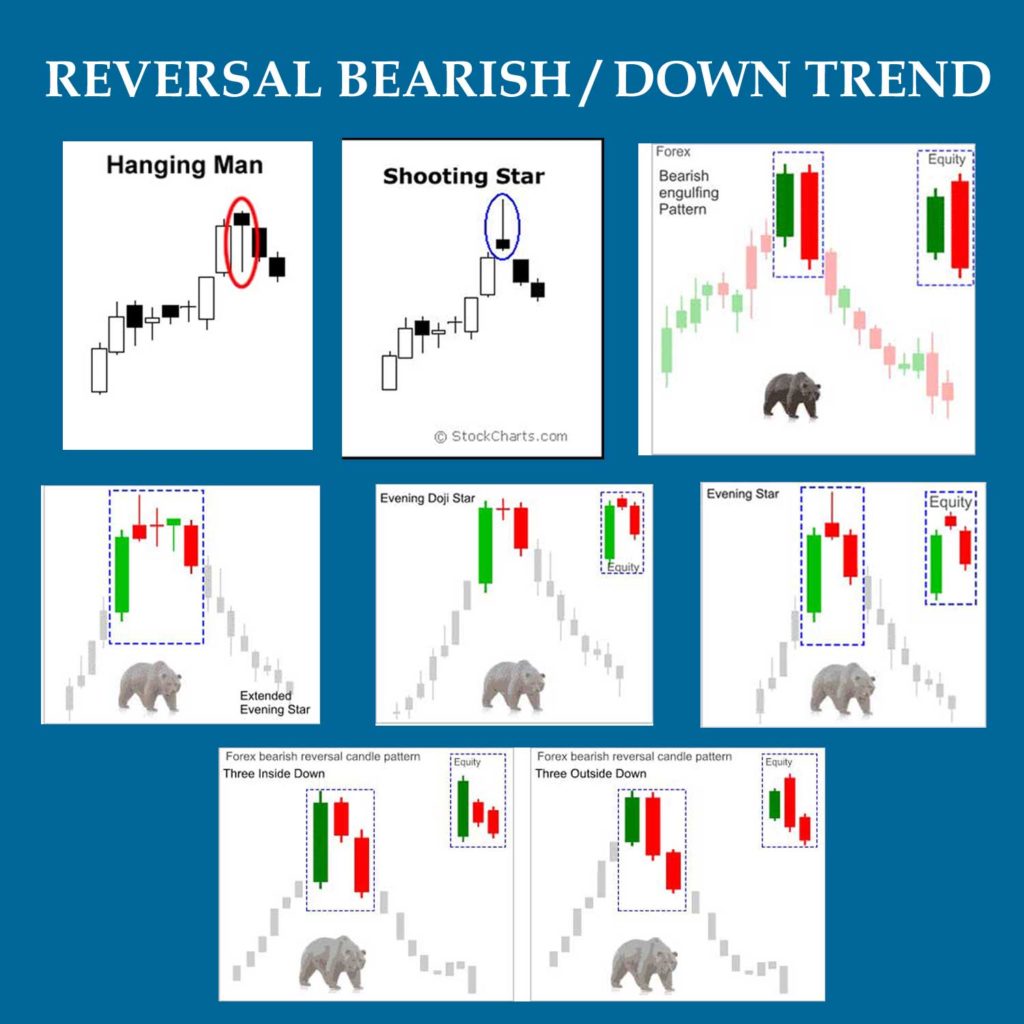
1. Engulfing (two-candle)
The first candlestick has a bullish close followed by a candlestick that has a bearish close. The second candlestick is ‘engulfing’ or ‘covering’ the length of the first one (the wicks are not considered).
The pattern has two meanings:
• The buyers have a momentary control of the price, as shown in the first candlestick where it is closed bullish
• The sellers took over the control from the buyers, as shown in the second candlestick which shows huge selling pressure
2. Shooting star (one-candle)
The shooting star pattern has little to no lower wick but a long upper one (around twice or thrice of the body’s length), and the price is closed at the bottom quarter of the range.
The pattern signifies several things:
• After the market is opened, the buyers took control. They then pushed the price higher
• When the selling climax is reached, huge selling pressure came into play which pushed the price lower
• This selling pressure is so strong it closed below the open part of the candlestick
3. Dark cloud cover (two-candle)
A dark cloud cover has a bullish close on the first candlestick and a bearish close on the second one. It is similar to the engulfing pattern. The difference is that the second candlestick is smaller and covers slightly over half of the first candlestick.
The piercing pattern means two things:
• The buyers have a momentary control over the price as the first candlestick shows
• There is selling pressure moving the price higher
4.Evening star (three-candle)
The next reversal bearish candlesticks patterns are the evening star. It has three candlesticks. The first one closes bullish, followed by a small range on the second, and the third closes much lower than the first (over 50% of the first one).
An evening star signifies:
• On the first candlestick, the buyers have the control as the price is closed higher
• On the second, the market is in indecision as the buying and selling pressure cancel each other out
• On the third, the sellers took over the control as the price is closed lower
5. Tweezer top (two-candle)
This pattern shows that there is a rejection of higher prices which is shown on the first candlestick, followed by retesting of the first candlestick on the second candlestick, closing the price lower.
There are two meanings of the pattern:
• The buyers tried to push the price lower, which then faced some selling pressure. This is seen on the first candlestick
• The buyers tried to push the price lower again. This time, however, they failed and the price moves downward, which can be seen on the second candlestick
Candlesticks Patterns and Multiple Time Frame Analysis
Can you use forex candlesticks patterns strategy for multiple time frame analysis? Yes, you can. With that being said, the time frame will vary from one trader to another. For example, the trend time frame and entry time frame for a day trader are a one-hour chart and a 15-minute chart versus a swing trader’s daily chart and four-hour chart, respectively.
Golden Rule To Be Mastering Using Reversal Candlestick Patterns as Primary Strategy
The first rule is reading engulfing on four hour chart or daily chart. Then looking for nearest new high or new low on those time frame. I mean nearest high and nearest low which engulf from current price. See example below :
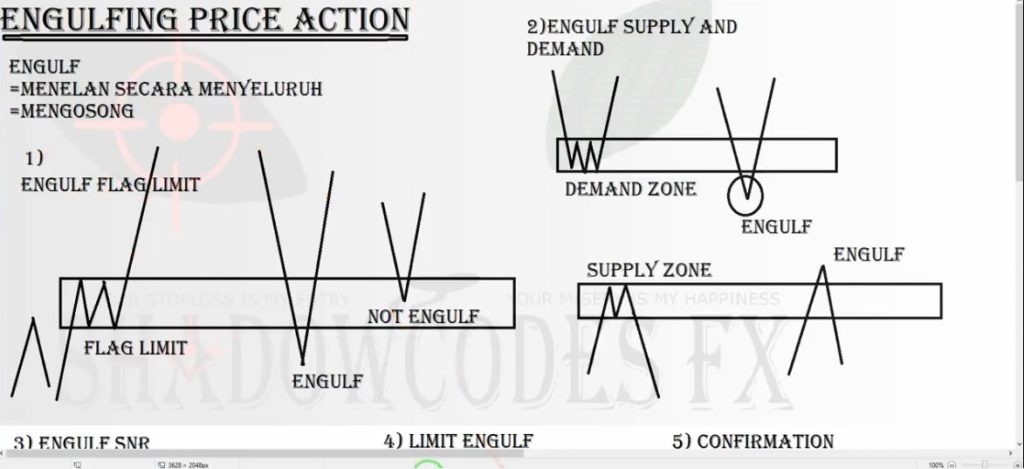
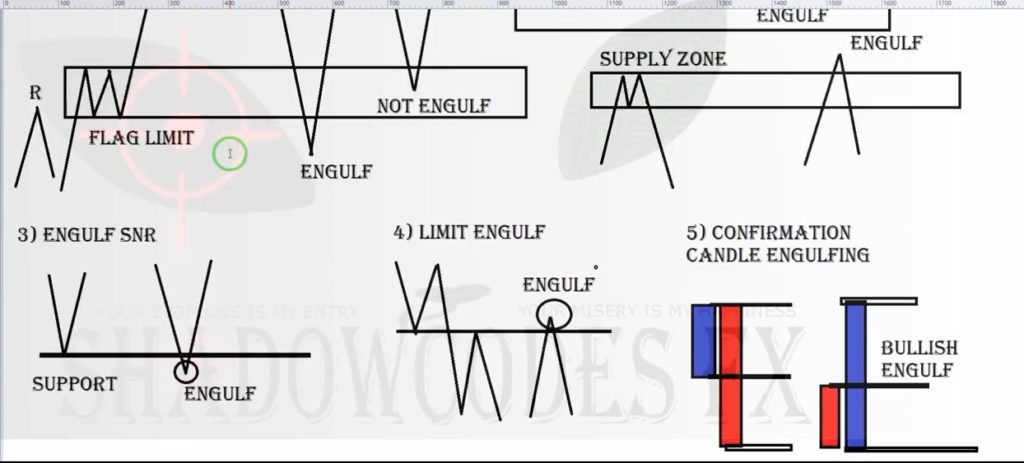
Looking at engulfing pattern first, second see quasimodo pattern or head and shoulder pattern(see sample patterns below), and lastly looking for entry in a base. A base mean high low from forex reversal candlestick patterns (bullish and bearish reversal candlestick patterns) in engulfing zone which in a quasimodo pattern (high-low-higher high-lower low for selling setup and low-high-lower low-higher high for buying setup).
Remember and very important, this reversal candlestick patters should appear on small time frame and on liquidity area that still on the small time frame like 5 minutes or 15 minutes to get fastest confirmation that follow from major trend on big time frame. Learn more about liquidity forex trading strategy below 😉
See these 3 patterns for the rule.
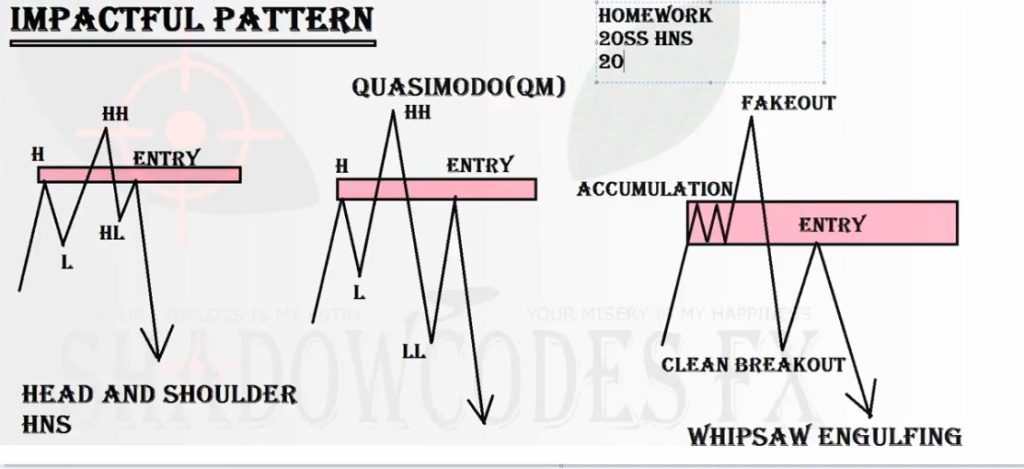
After engulfing and impactful pattern found then looking entry zone in reversal bullish candlestick pattern in quasimodo zone(low-high-lower low-higher high) or in engulfing zone in quasimodo zone for buy setup and looking entry zone in reversal bearish candlestick pattern in quasimodo zone (high-low-higher high-lower low) or in engulfing in quasimodo zone for selling setup.
Tips : use at least four hour time frame or daily for reading primary engulfing and quasimodo then entry in reversal candlesticks patterns which in engulfing area which in still in quasimodo pattern in smaller time frame.
We can combined institutional candle (order block) with this forex candlesticks strategy.